Research
Whereas a lot of research was performed at the start of the design process to find out whether there was an opportunity to apply AR technology in the area of urban design and urban planning, we had not validated yet whether there was an interest among citizens to actually be involved more in the process of urban design and urban planning.
A questionnaire was created to find out the following aspects:
- Citizens’ current satisfaction with their environment.
- Citizens’ knowledge about possibilities to be involved in urban design and planning.
- Citizens’ interest in being involved more in urban design and planning.
The questionnaire can be found here: https://forms.gle/6A4h2F8bhfxVveUd6
We eventually got 59 responses from a wide range of ages. Their answers were analyzed used pandas, a python library for analyzing data.
The bar graph shows the majority of users are interested in participating more in the process of urban planning and design. The second bar graph clearly shows it is generally perceived that the municipality does not include citizens enough in the process and does not offer enough and appropriate tools. In many cases, people don’t even know of methods to contact the municipality about this matter. The ones who did find the opportunity to participate in a co-design session were often left unsatisfied as they felt they weren’t listened to appropriately:
“I was invited by email to give input on redesigning the nearby park. I gave lots of new ideas … nothing was done with any of my or other’s input since they decided to throw in tiles only. No, I wasn’t heard, even angry, and will never participate again.”
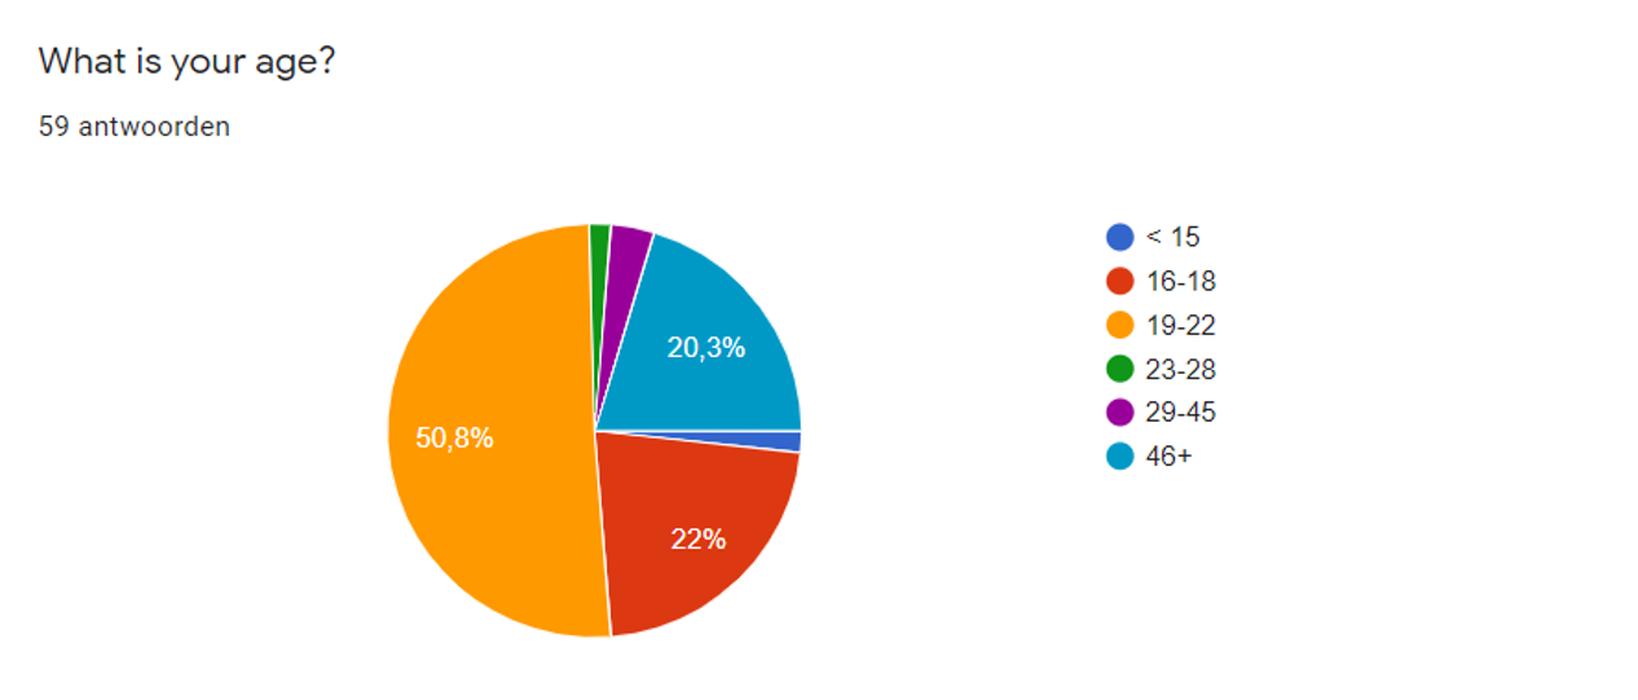
The age division of all participants
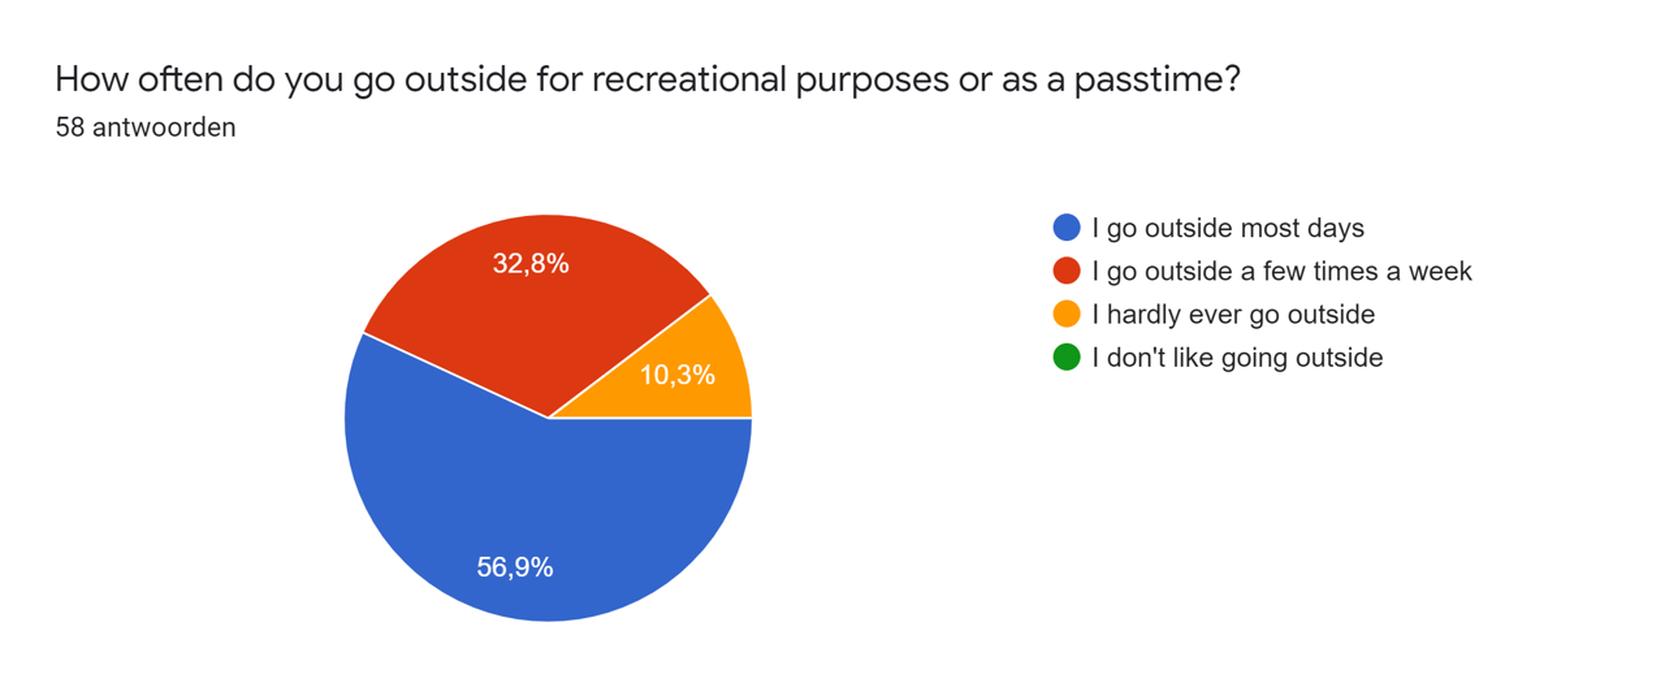
How often people go outside for recreational purposes
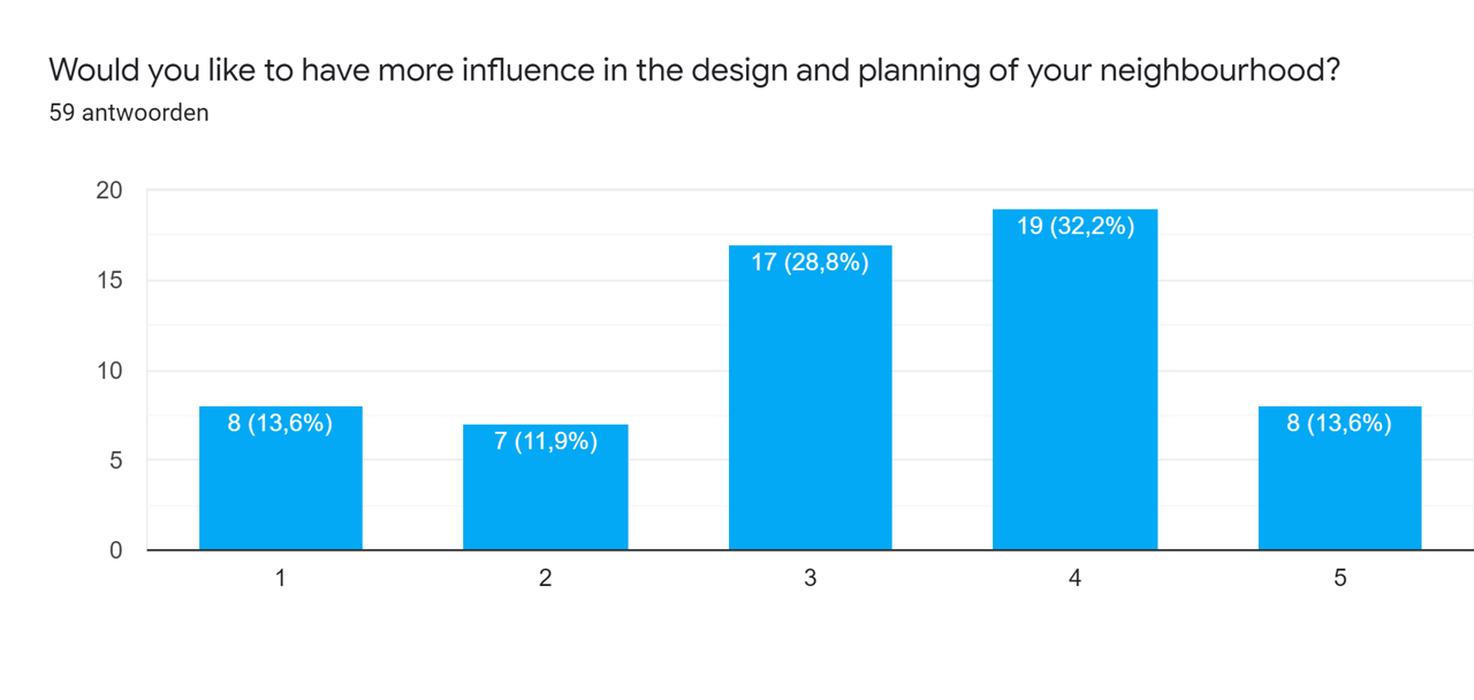
A graph showing how many people are interested in participating more in urban design and planning
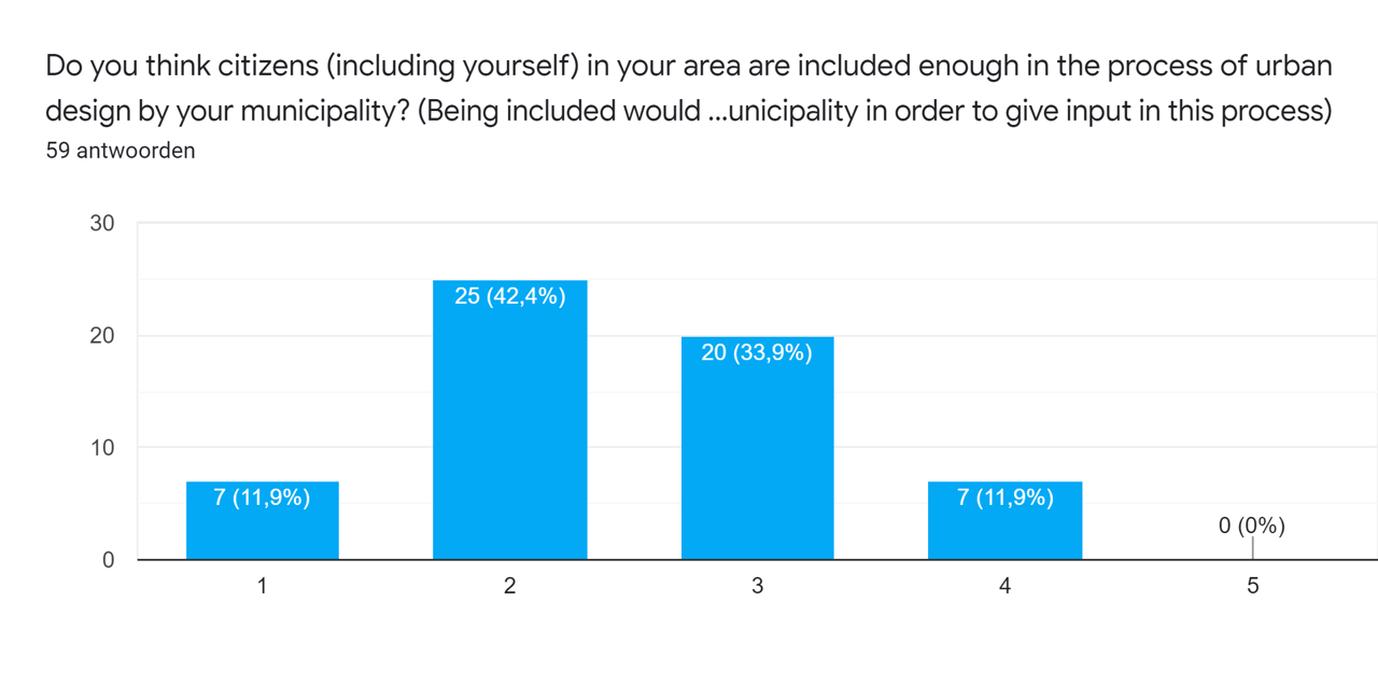
People's perception of whether they are included enough in the process
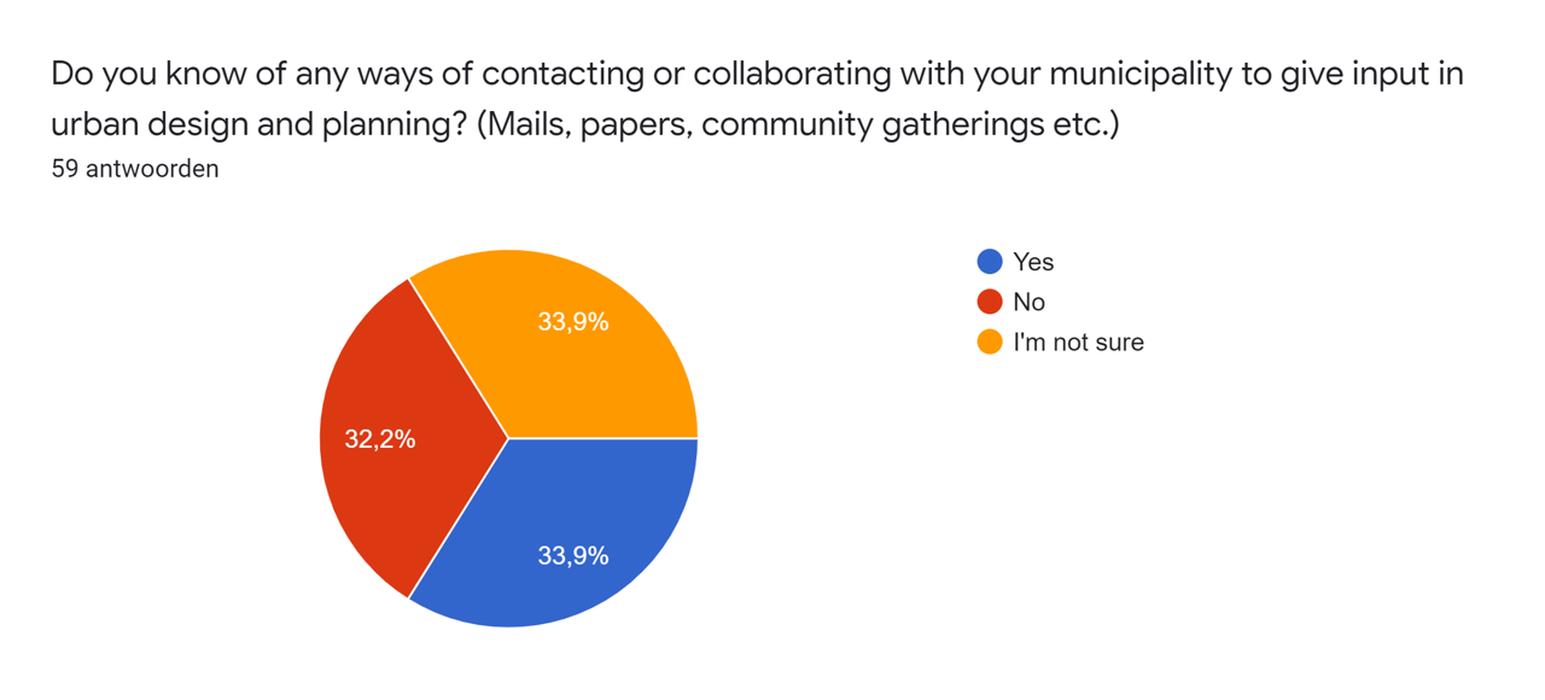
People knowing ways of contacting the municipality
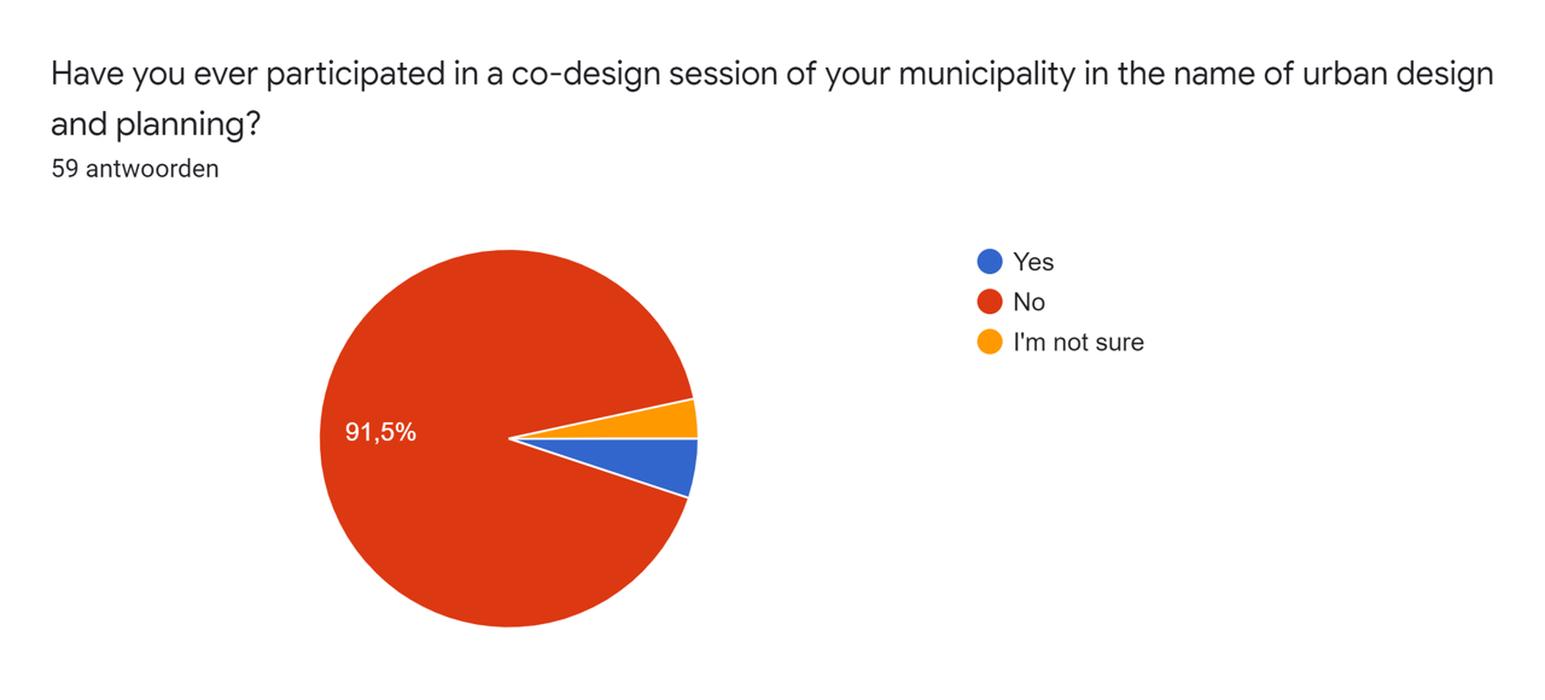
People having participated in co-design sessions
Apart from the visuals created by Google itself based on the questionnaire’s data, we analyzed this data in python. Heatmaps were created as these could clearly show the data’s correlation. Both heatmaps show the assessment of citizen’s satisfaction with their environment, their interest to participate more in the process of urban design and planning and whether they feel like they are included enough in this process by the municipality (by means of being provided appropriate tools) on a scale on 1 to 5 (1 = Not at all and 5 = Yeah totally). This is analyzed per frequency of going outside and per age group.
From the left heatmap and right heatmap we can conclude that in general people are relatively satisfied with their environment, no matter the frequency they go outside. A fun result was the satisfaction was the lowest, the interest to participate in the process the highest and the assessment of being included enough the least for people who go outside only a few times a week. This could be because they are not fully satisfied with their environment to go outside more and therefore want to change that, but are not offered the appropriate tools. Our app offers the opportunity to vote for ideas from their own homes. This makes the app more accessible to especially these people. An unexpected insights was given by the right heatmap. The least satisfaction and highest interest to participate in the process was amongst people in the age group of 23-28 years. They also thought the municipality does not include them enough. This could be because at this age one is more conscious about their environment because they are older and feel like they want to do something about it.
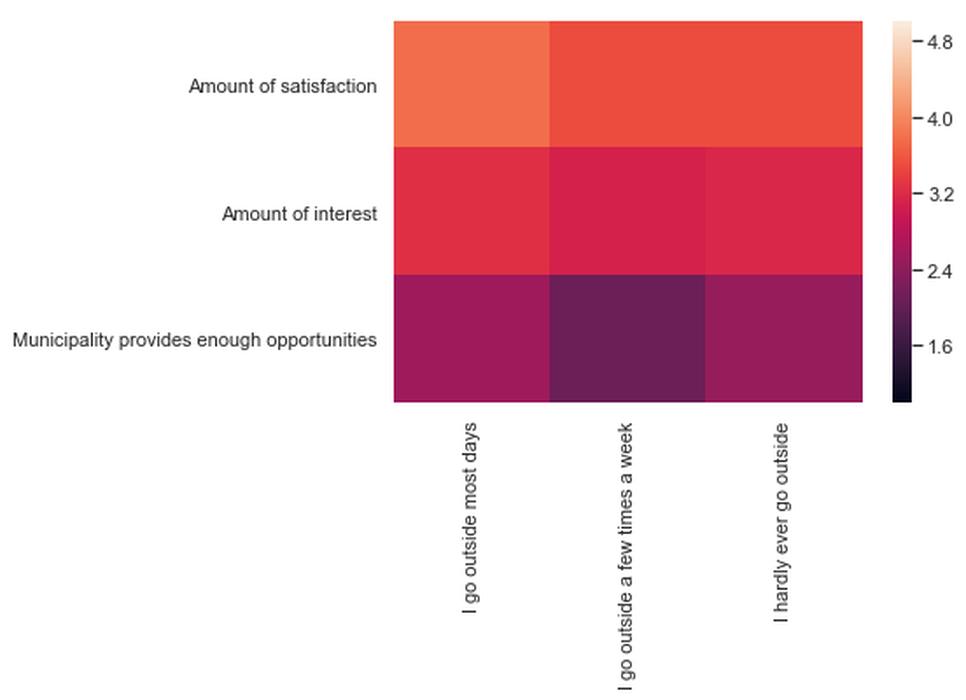
Percepting of satisfaction, interest and enough opportunities per frequency of going outside
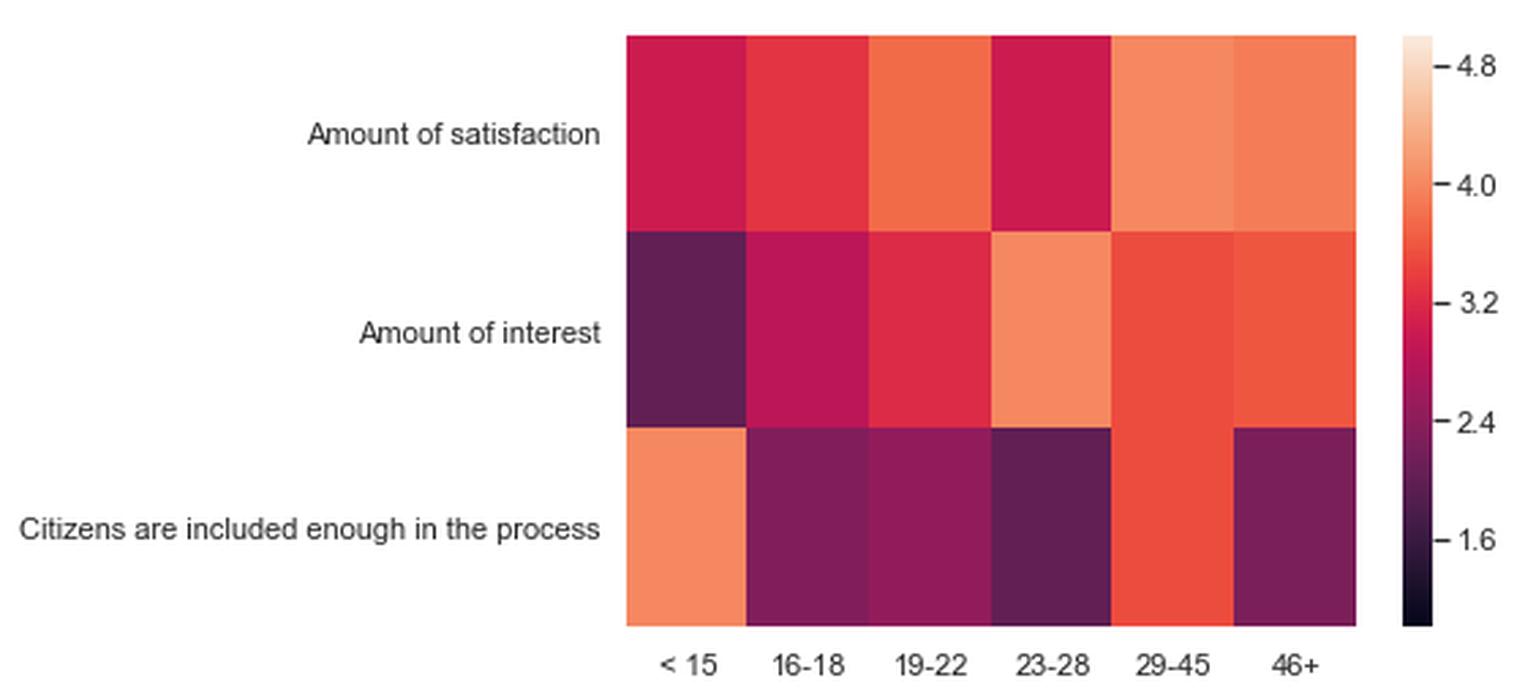
Percepting of satisfaction, interest and enough opportunities per age group
However, the multiple bar graphs also show there is a big fluctuation in satisfaction among different aspects of people’s environment: we need to mainly focus on implementing assets such as benches to sit down, bins against littering, playground-related objects for recreational purposes and some primitive shapes for people to create art or decoration.
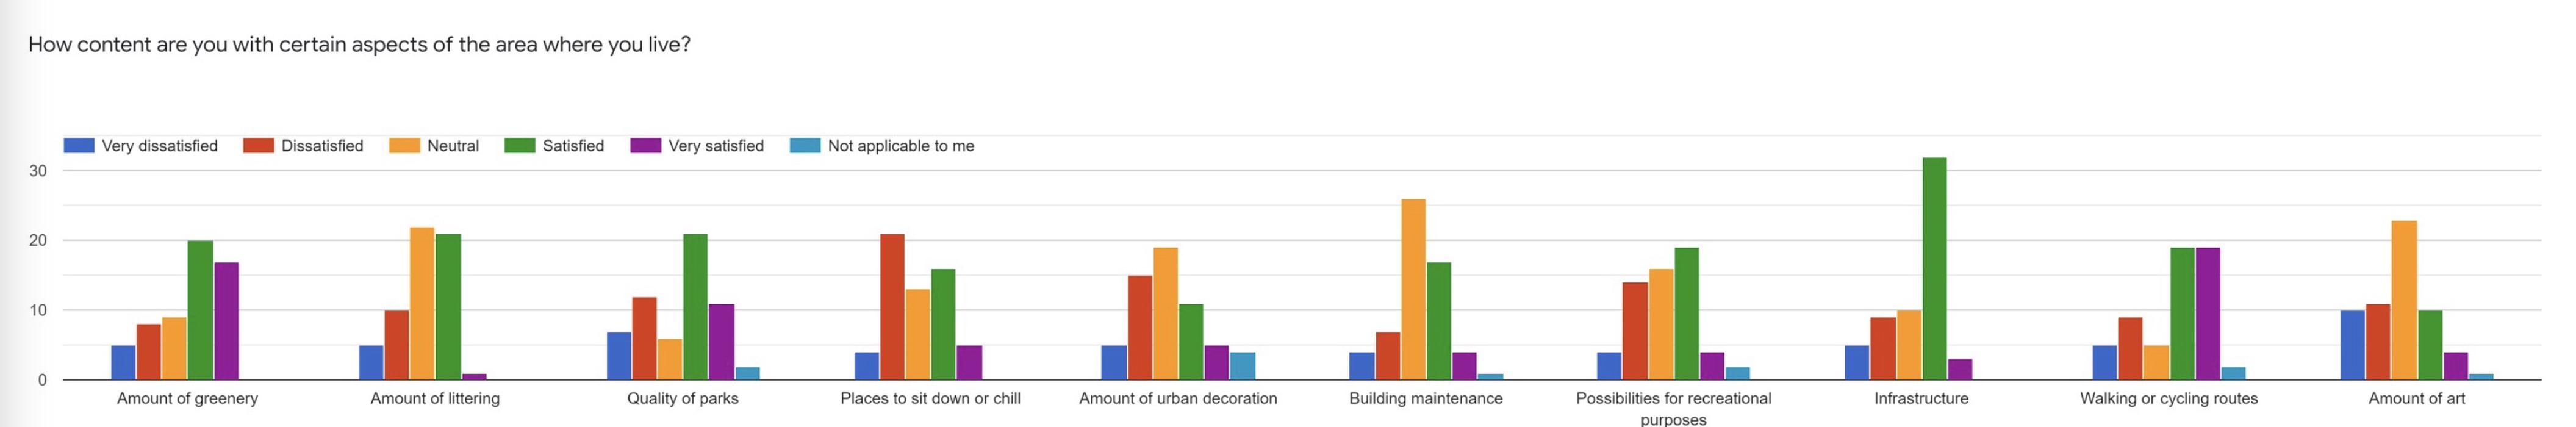
Amount of satisfaction per aspect of people's environment
The results indicates the an engaging communication tool between citizens and municipalities certainly offers the potential to give citizens the power to have a saying in what happens in their own neighborhood. We believe the possibility for citizens to clearly visualize their ideas, as well as vote for these builds, will help the municipality to better understand the needs and wishes of their citizens.
Read further at Platform →